
Diagrams are a great way to understand better information and data that would otherwise be represented just by numbers. For example, a Sankey diagram is a great way to understand your spending and money better. However, creating diagrams may be easier and more convenient with the correct tools. Fortunately, there are plenty of internet solutions that enable you to freely and create these diagrams.
What’s A Sankey Diagram?
A Sankey diagram is a form of a diagram that depicts the flow of values from one set to another. This is accomplished by drawing a branching line or arrow, with the width of each line proportionating to the number of branches. They are often employed in material flow accounting and analysis, as well as in energy accounting. Nonetheless, if this is your first time hearing of them, you should be able to use them for cost breakdowns. In addition, knowing where and how your money is moving is a great visual sign of what you’re spending it on. Regardless of their purpose, Sankey diagrams are a great way to visualize branching or diverging data readily.
1. SankeyDiagram.net Sankey Diagram
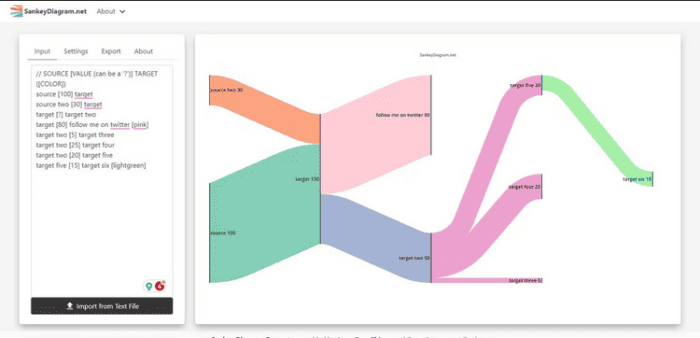
If you’re searching for something easier to work with, SankeyDiagram.net is a great option. This Sankey diagram generator refreshes rapidly while you work and automatically handles many formatting and aesthetics. All you need to do to get started with SankeyDiagram.net is input your data. There’s an example provided here, and it’s easy to grasp, but if this is completely new to you, it may take some time to get used to.
You can import data from a text file, although this is the same as copying and pasting your data into the text box, which is more convenient than functionality. Finally, SankeyDiagram.net handles the remainder of your options. You can do more here with decimal changes and output sizes, but most of the work is done for you. There’s also an intriguing anonymize data method that substitutes the values of your labels and data with random values that keep the same flow, which might be handy for some.
2. SankeyMATIC Online Sankey Builder
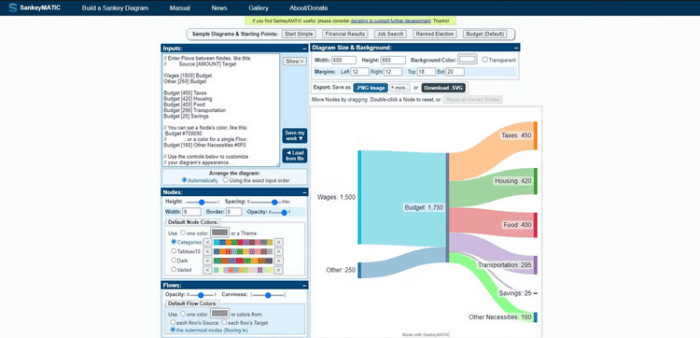
SankeyMATIC’s Sankey diagram creator is next on the list. With plenty of tools to generate a great-looking diagram regardless of knowledge, this Sankey diagram generator is a great option. There is no tutorial for SankeyMATIC; however, you may use a few example diagrams to understand how to use them. Nonetheless, if this is the first time you’ve used something like this, the way the data is inputted to generate the diagram might be a little complicated. SankeyMATIC is easy to use once you get the hang of it.
You can acquire your data from a file in addition to being able to input it manually. From there, you may adjust the appearance of your diagram using various modification options. For example, you may modify the general color scheme or the color of individual flows, as well as how much they curve, how opaque they are, how far apart they’re, and other settings. When you’re finished, exporting is a breeze, with plenty of options for adjusting the appearance of your final picture.
3. Sankey Diagram Generator
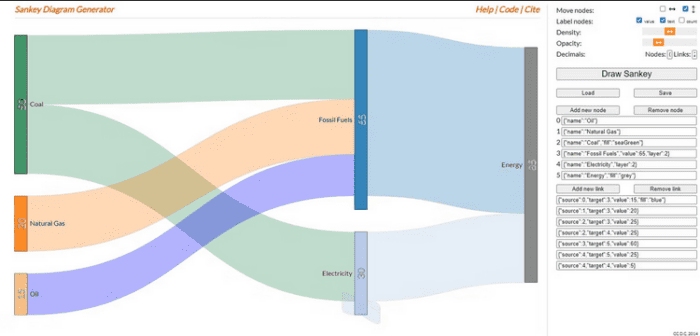
The Sankey Diagram Generator comes next. If you want something with a bit more of a UI while still having plenty of options to adjust the overall appearance of your diagram, Sankey Diagram Generator is a great little tool to help you do that. To use Sankey Diagram Generator, just input your data on the right side of the screen in the form of nodes and connections. There are additional options for adding colors and values as you go here. Sankey Diagram Generator then provides options for adjusting the density, opacity, values, text, and more. It’s a different way of entering data than other things on the list, but it’s handy.
4. The Sankey Diagram Generator by Acquire Procurement Services
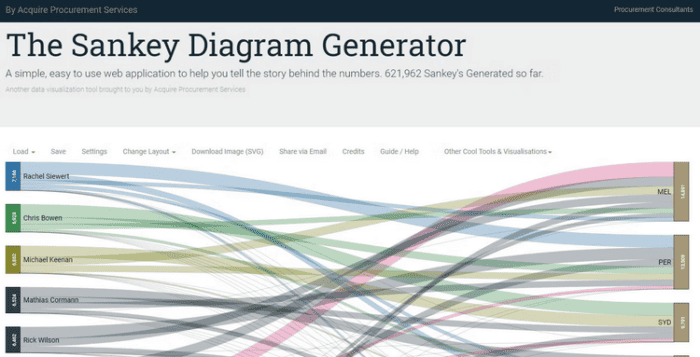
The Sankey Diagram Generator from Acquire Procurement Services is up next. This Sankey generator is a great way to create basic, easy-to-use diagrams to visualize data flow. This is a terrific option to explore if you prefer something visual rather than text-based. Click the created diagram to change it to your taste to create a great-looking diagram.
This may involve creating new connections, joining other nodes, and adjusting the color. When you’ve completed the sketch of your diagram, you can use this Sankey diagram generator to experiment with various layouts and spacing options to find the most natural representation of your data. You may also enter your data straight into the website to create a Sankey diagram if you prefer to input your own data rather than manually creating a diagram. This website supports data in the following formats: JSON, CSV, and Excel pivot tables, so you should be able to find a way to describe your data that works here.
Conclusion:
There are many online options for creating Sankey diagrams that you may use. This is a terrific way to visualize your cash flow or spending immediately. There are several ways to include diagrams in your daily life, and once you discover how simple they are to use, you’ll wonder why you didn’t do so sooner.